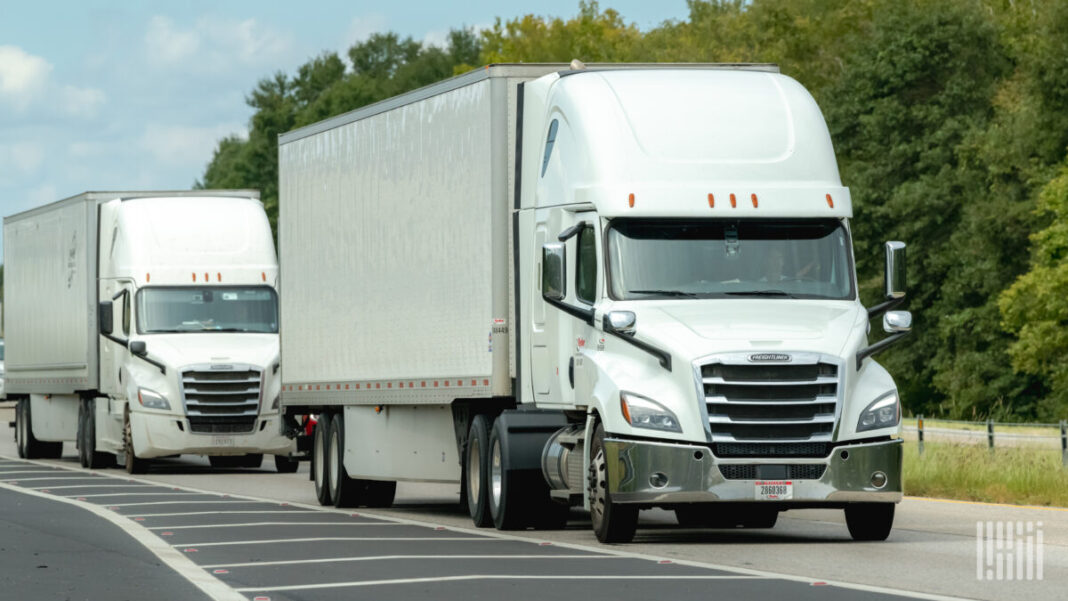
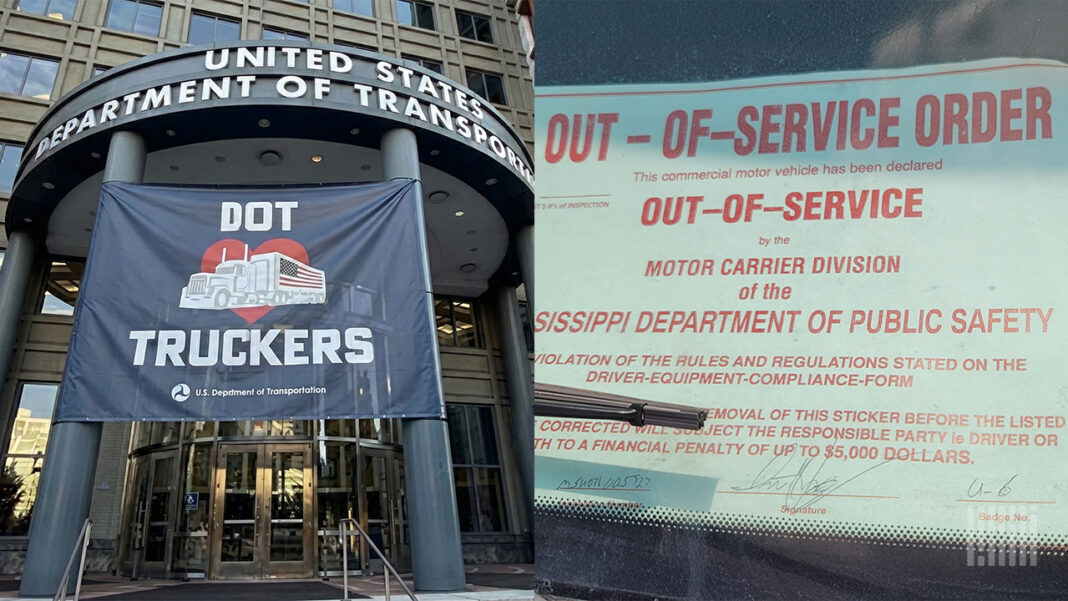

$44.89. I start there because I am a trucking, blue-collar, diesel, hard-handed, hard-headed truck driver at heart. I just turned into a hybrid expert witness, risk expert, and writer. I say this because I never in a million years thought I’d be here, naming California among the top five in trucking enforcement. EVER. Yet here we are.
$44.89 is the cost to put a trained officer’s eyes on one truck at the roadside in California. Cheapest inspection in America. The California Highway Patrol did 455,237 of them in fiscal 2025, more than any state in the country, nearly one of every six commercial vehicle inspections performed in America last year.
It is also the operation the federal government decided to defund.
Here is the short version of the past year if you have been driving instead of doomscrolling. Washington and the states have been in the biggest fight over truck enforcement that most of us have ever seen. Money withheld. A state licensing program was suspended. Seventeen thousand CDLs revoked. California is suing the Transportation Secretary and the FMCSA Administrator personally, in federal court. Both sides have spent a year throwing numbers at each other about who enforces and who doesn’t.
Nobody finds math and data sexy anymore, yet here we are, I did it, using the government’s records. Every dollar of federal inspection grant money obligated from 2021 through 2025, $841 million of it in fiscal 2025 alone. All 2.9 million roadside inspections from that year. 1.24 million crash records, once I finished repairing the government’s crash files, which, as you’ll see, needed repairing.
What the data says doesn’t fit anybody’s talking points. The state being punished runs the most productive inspection operation in the country. Two-thirds of the English proficiency citations everyone is yelling about never took a single driver off the road. The most damning claim the feds made about California checks out in three different ways. The federal data both sides keep quoting literally changed shape the moment the fight started, which means some of what everybody “knows” this year isn’t real. It’s an echo of the fight itself.
The year the money became the weapon
First, the money. There’s a federal grant program called MCSAP, the Motor Carrier Safety Assistance Program. It’s the checkbook that pays for the officer who inspects your truck. Roadside inspections, scale house staffing, traffic enforcement, and new entrant audits, nearly all of it runs on MCSAP money in every state. When Washington threatens a state’s MCSAP funding, it’s threatening to unplug that state’s inspection program.
The timeline.
April 2025: Secretary Sean Duffy tears up the old guidance that told inspectors they didn’t have to place drivers out of service for English proficiency violations.
June 25: ELP returns to the out-of-service criteria for the first time in a decade, meaning a driver who can’t demonstrate English at the roadside gets parked on the spot.
August: after the Florida Turnpike crash that killed three people, involving a driver holding a California license, the department sends formal warnings to California, Washington state, and New Mexico. Duffy’s words: “enforce the Trump Administration’s English language requirements or the checks stop coming.”
October 15: the checks stop. FMCSA withholds $40.7 million from California. December: California sues.
January 7: FMCSA hits California again, this time over 17,000 improperly issued non-domiciled CDLs, putting roughly $158 million more on the line. March 6, 2026: those 17,000 licenses finally get revoked, two months late. New York, Minnesota, and Pennsylvania have been told they’re next in line over their own licensing practices.
That’s the fight. Now the rankings.
The rankings: what an inspection actually costs, state by state
Take each state’s federal enforcement money and divide it by the inspections that state performed in fiscal 2025. That’s the bang-for-buck table, and the spread will surprise you.
The five cheapest inspections in America: California at $44.89, Montana at $49.55, Arizona at $77.72, Illinois at $80.95, and Maryland at $92.86.
The most expensive: Hawaii at $745, Rhode Island at $481, Virginia at $424, Alaska at $390. Sixteen times more in Honolulu than in Sacramento for the same look under the same truck. Some of that is fair; an island state can’t spread its costs across 400,000 stops, but the middle of the table is where it gets interesting for anyone who runs these highways.
Virginia, my home state, paid $423.78 per inspection last year and performed just 26,265 of them. That’s one of the weakest showings among big states, and Virginia has drawn exactly zero federal heat while states inspecting at five times that rate get threatened. Virginia needs some heat.
Arizona is the trucking enforcement all-star, issuing violations at a rate lower than anyone else at $28.20 apiece, and parking a driver or a truck at 43 percent of its stops. If you’ve ever been through an Arizona inspection and felt like they weren’t playing around, the numbers back up your gut. Texas runs the second biggest program in the country, 362,655 inspections, and writes more paper per stop than anyone: 2.34 violations per inspection.
Then there’s Wyoming, which every haul driver already understands. Wyoming’s out-of-service rate is the highest in America: 59 out of every 100 inspections take a driver or a vehicle off the road. Sounds like Wyoming trucks are junk, right? Wrong, 85 percent of the trucks in Wyoming crashes wear out-of-state plates, the highest share anywhere. Wyoming isn’t producing bad trucks. Wyoming is the filter. It sits on I-80 and screens the whole country’s worst equipment as it rolls through. New Mexico, West Virginia, and Montana do the same job on their corridors. When those states inspect, they’re doing the nation’s dirty work on a state grant check, and we should credit them for it. If we really wanted to focus on immigration enforcement and trafficking, I’d say Wyoming deployment to weigh scales is a good start.
The states even hunt differently, and the data shows each one’s personality. Georgia and Indiana are moving-violation states, with unsafe driving making up 35 and 39 percent of the paper they write, the highest shares in the country; if you got lit up for speed in a truck last year, odds are it was there. Worth noting that this is a good hunting strategy because unsafe driving is the gateway drug that gets you pulled, which then leads to driver- and maintenance-related hours-of-service violations that compound as secondary violations. Want to avoid getting pulled here? Don’t speed, stay off the phone, and keep your truck clean. Enforcement will know where to best spend their time.
Texas is the opposite animal: 90 percent of its violations are vehicle maintenance and less than one percent are unsafe driving, with equipment operation almost to the exclusion of moving violations. Massachusetts writes driver fitness violations, licensing, and qualification paper, at nearly triple the typical state’s rate. Fifty states, fifty enforcement philosophies, and until now, nobody had measured them.
The funding figures come from federal grant obligations in USAspending, spread across each grant’s actual performance period. Checked against FMCSA’s officially published formula allocations. California’s cost per inspection is likely closer to $70 or $80 than $44.89. Still among the best in the country. The rankings hold either way; the exact numbers in print will be the official ones.
They defunded the top of the table
Now put two facts side by side. The most productive inspection operation in America, with the most inspections and the lowest cost, is the California Highway Patrol’s commercial program. The state that lost its inspection money is California.
Whatever you think about California and English rule, hang on, because the data is about to complicate your thinking. Taking $40 million in MCSAP money from California means removing roughly 900,000 inspections’ worth of capacity at California’s unit cost. That’s the trade. Maybe it’s worth it. Rules only mean something if breaking them costs something, and the department clearly decided California’s defiance was the thing to make expensive. That’s a bet, with the chips being inspections, and the driving public was never shown the stakes. Fewer inspections don’t punish Sacramento. It punishes whoever’s in the lane next to the truck that didn’t get looked at.
The English test, tested
Now the ELP numbers themselves. When an inspector issues an English proficiency violation, it is entered into the federal system under section 391.11(b)(2). But those violations come in flavors, and the flavors matter. In the federal violation data, a large partial extract of the national feed, more on that in the methodology, the single most common ELP citation in America is a special border zone version, written to drivers operating in the commercial zones along the Mexican border. In my extract: 19,339 border zone citations. Out-of-service orders resulting from them: 40. That’s two-tenths of one percent. The real enforcement versions are the opposite: the most common goes out-of-service 71 percent of the time, and another 91 percent.
Translation, roughly two-thirds of raw “ELP violations” in federal data are border paperwork that never takes anyone off the road, and it piles up in border states. So, every hot take you’ve seen ranking states by raw ELP violation counts was really just measuring distance to Mexico.
Then there’s the question at the center of California’s lawsuit. The government’s core claim, the one the $40 million rides on, is that between June 25 and August 21 of last year, California conducted roughly 34,000 inspections that found violations and produced exactly one English proficiency out-of-service. One driver.
I now have three independent data points on that claim, and they all agree. My database extract, which covers about 22 percent of California’s violation volume, contains exactly one enforcement-grade ELP violation from that window, which scales to roughly five statewide. My own count published in January, built separately from monthly FMCSA data, found eight ELP violations across the longer May-through-September window. FMCSA’s enforcement filing claims one out-of-service. Three different methods, three different windows, and every one of them lands in single digits against a six-figure inspection program while 49 other states were parking drivers. California’s lawyers argue roadside ELP enforcement was never federally required in the first place, and that question belongs to a judge, not a database. The fact underneath it holds up from every direction I can test it. This piece is about to be hard on the federal data, so let the record show: where the government was right, the numbers say so.
The flag that flipped
The finding I didn’t go looking for. Every crash record in the federal system has a checkbox, basically: did this driver have a valid license? I pulled that field, going back to 2022, quarter by quarter, sorted by the state that issued the driver’s license. For thirteen straight quarters, in state after state, the share of crash-involved drivers coded as unlicensed sat at or near zero. Louisiana: zero. New Mexico: zero. Oklahoma: zero. Texas: under 1% every quarter for 3 years.
Then, in spring 2025, the exact moment the federal crackdown started, the checkbox went haywire. Texas jumped from 2 percent to 30 percent to 79 percent. By late summer, the federal database claimed that four out of five Texas-licensed drivers in crashes had no valid license. New Mexico peaked at 35 percent. Then, in January 2026, every one of those states snapped back to zero as fast as they’d spiked. Texas: 0.3 percent. The whole time, the actual number of crashes involving Texas drivers never budged. About 4,700 a quarter, steady as idle, while the “unlicensed” share went from nothing to four in five, and back to nothing, within a year.
Texas drivers did not become 79 percent unlicensed last summer and cure themselves by New Year’s. What changed wasn’t the drivers. It was the checking. Somewhere in the reporting chain, somebody started flagging that box when the political heat came on, and stopped, or got new instructions, when the calendar turned. Either that or the flag gets filled in months after the crash during records review, so the newest data always looks clean and dirties up later. Both are testable, and I’m testing them: I’m now saving these numbers every month, and I’ll report which one it is. NOTE: Review SafetyNet offices on coding guidance changes in Q2 2025 and Q1 2026.
Want proof the checkbox can’t be trusted? Look at North Dakota, the one state that never snapped back. Starting mid-2025, crash records for North Dakota-licensed drivers tripled in volume, and up to three-quarters were flagged as unlicensed. So I pulled the companies behind those records. Waste Management of North Dakota. The City of Fargo. The City of Grand Forks. The North Dakota Department of Transportation itself. According to the federal crash database, Fargo’s own city drivers and the state DOT’s employees are out here unlicensed at wild rates. That’s not a driver problem. That’s a broken reporting pipeline in Bismarck feeding garbage into Washington, and it’s been doing it for a year. NOTE: on-record query to NDDOT crash records and ND Highway Patrol: what changed in Q2 2025?
Here’s what it means. That checkbox doesn’t measure whether drivers have licenses. It measures whether anybody was checking, and the checking changed the second the politics did. People made enforcement great again. Washington spent a year waving licensing numbers to justify punishing states that demanded enforcement. States waved numbers back. Underneath both of them, the measuring stick was bending in the wind of the very fight it was supposed to referee. If someone quotes you an unlicensed-driver statistic from 2025, ask them which quarter, because the answer changes by 79 points depending on when the coding mood shifted.
Did any of it make the roads safer?
The honest answer is too early to tell, and so far, nothing’s moved. I tracked every crash in the country involving a California-licensed driver, month by month, straight through the whole pressure campaign: the English order, the money withheld, the licensing program suspended, 17,000 revocations hanging overhead. In 2024, California-licensed drivers showed up in 12,600 crash-vehicle records. In 2025, with all that federal pressure applied: 12,472. Flat. No wave of dangerous drivers flooding the roads like one side warned. No drop as the crackdown supposedly cleared them off, as the other side promised. The needle sat still.
To be fair to the crackdown, the real test hasn’t run yet. Those 17,000 revocations didn’t actually happen until March 6 of this year, and crash data takes one to three months to fully land in the federal system, longer in some states. So the post-revocation road isn’t yet visible in the numbers. It will be by fall. I’ll run the exact same numbers again in October and print whatever they say, up, down, or sideways, just in time for the election.
The plate on the truck tells a story
One last cut of the data. Every crash record shows the state on the truck’s license plate. Separately, every state participates in a federal registration-screening program called PRISM at one of three levels. Seventeen states do the bare minimum, checking only whether the exact company applying for plates is banned. Thirty-three jurisdictions do more, screening whether the truck or the people behind it trace back to a shut-down carrier sneaking back in under a new name, what the industry calls a chameleon carrier. Exactly one state, Washington, extends that screening down to the lighter trucks, the hotshots and one-tons, where the worst of the ghost fleets live.
So, do trucks plated in strict-screening states crash less than trucks plated in minimum-screening states, adjusting for how often each state’s trucks are actually out there getting inspected?
They do. Trucks plated in the 17 bare-minimum states: 65.9 crash involvements per thousand inspection encounters. Trucks from the 33 stricter states: 58.6. Trucks plated in Washington: 35.9. Narrow it to small fleets, one to nineteen trucks, the owner-operators whose plate state really is home, and the gap gets wider: 52.2 versus 44.8 versus 27.8. The harder a state screens its registration counter, the less its fleet crashes per encounter, and the effect is strongest exactly where you’d expect screening to matter most.
What does this prove? It’s a pattern, not a smoking gun. Washington is one state. Strict-screening states differ in geography and traffic too. The pattern runs clean in one direction; it gets stronger right where the screening theory says it should, and the agency that runs PRISM has never once calculated it. The data is theirs. Somebody over there should.
What it took to make the government’s data usable
Everything in this piece comes from public federal data, and maybe the most important finding is what I had to fix before that data could be trusted, because the shakiness of this stuff isn’t a footnote to the enforcement fight. It’s a player in it. Data quality is an open issue.
Maryland takes an average of 165 days, five and a half months, to get a crash record into the federal system. More than a third of Maryland’s crashes take over 90 days. Every recent-months trend you see anywhere is missing crashes that haven’t been filed yet, which is why every chart in this piece stops 90 days short of today, on purpose.
The data layer underneath the biggest state-federal enforcement war in trucking history runs a quarter behind reality, and codes drivers as unlicensed depending on the political weather, up to and including the snowplow drivers of Fargo. Highway safety has become so dumb and partisan that we need a referee. Maybe this data helps.
(Methodology fine print: Funding is the total of all MCSAP grant obligations in USAspending FY2021-2025, allocated across each award’s period of performance; headline figures are cross-checked against FMCSA’s published formula allocations. Inspection, violation, and OOS totals come from 9.5 million federal per-unit inspection records, validated at 99.9 percent duplicate-free, and reconcile to 2.9 million national inspections in FY2025; the vehicle out-of-service rate computed from these records matches FMCSA’s published 21.6 percent exactly. Code-level violation detail (the ELP and enforcement-personality analyses) comes from a partial extract of the federal violation feed covering roughly 22 percent of national volume; coverage varies by state from 18 to 42 percent and runs highest in border states, so within-state proportions and time trends are reported directly while any cross-state count is coverage-adjusted or presented as extract-based. Crash figures use the deduplicated MCMIS file described above, counted at the crash or vehicle level as stated, with 90-day maturity cutoffs on all trends.)
What the ledger can’t tell you
Three limits, because a piece built on other people’s sloppy numbers has no business hiding its own. Cheap violations can mean efficient enforcement or just dirty trucks, so no ranking here stands on cost-per-violation alone. None of this proves cause and effect; the ledger shows what enforcement money produces, not what it prevents, and the crash question stays open until fall. The ledger has pages still locked away: every state reports its registration denials and suspensions to FMCSA quarterly, numbers that would let us grade registration enforcement the way this piece grades roadside enforcement, and they sit behind a government login.
Forty-four dollars and eighty-nine cents puts a trained officer’s eyes on a truck in California. Nobody on either side noticed that the statistics they’ve been throwing at each other changed shape the day they started being thrown. The ledger was sitting there the whole time in the government’s own files, counted ninety days late, coded by whoever happened to be checking. This year, of all years, somebody needed to read it.
Tomorrow: the same ledger, opened to the pages about the legislators and people who write the laws. Stay tuned.