
Freight cycles are anything but regular
We call them freight cycles, but the term implies a regularity the data doesn’t support. Since 2000, the domestic transportation market’s turns have looked less like clockwork and more like a series of random…
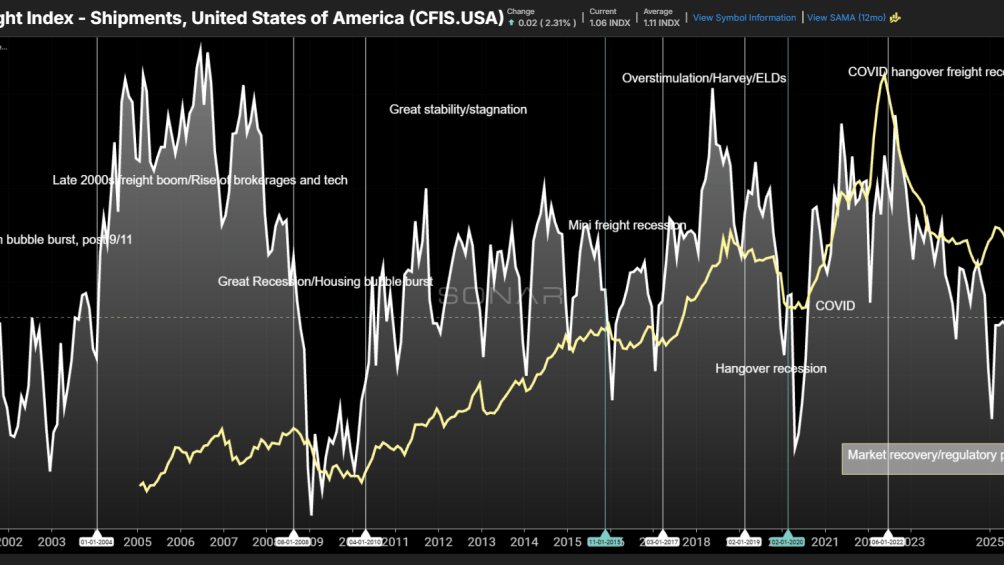
Chart of the Week: Cass Freight Shipments Index, Cass Truckload Linehaul Index – USA SONAR: CFIS.USA, CTLI.USA
The domestic freight market has been on a long-running rollercoaster since the start of the century. The Cass Freight Shipments Index (CFIS) and the Cass Truckload Linehaul Index (CTLI) show how each cycle has differed from the last, and why predicting when each one begins and ends is extremely difficult.
The CFIS includes shipments across truckload, intermodal, LTL and several smaller modes, making it a good representation of total transportation demand over time. Because it is based on invoice data, it runs with a slight lag.
The CTLI measures the base cost of a truckload move, excluding fuel and accessorial charges. That makes it a good gauge of truckload rates without the influence of fuel, and base rates are a better indicator of supply and demand in the truckload market.
This story was originally published by FreightWaves. Read the full story at FreightWaves →



Conversation